During the first week of October 2013 there were about 310,000 Instagram posts in New York City, from over 100,000 users.
What did they sound like?
The sound of a neighborhood
Instagram reports that its 150M monthly active users post 55M times per day, worldwide.
The dataset we worked with contained Instagram posts in New York City, inclusive of several of the most “Instagramed” spots in the world (like Times Square, Central Park, and the High Line). We wanted to explore the usage patterns of the 101,775 users represented in our data, who posted to Instagram from New York locations over 300,000 times during the first week of October 2013.
After we did some initial explorations of the full dataset (see below), we noticed certain high-volume neighborhoods like Midtown, daytime-intensive spots like New York City parks, and late-night activity in Williamsburg and the Lower East Side. We began to imagine: What does an average day of Instagram posts sound like in each New York neighborhood? if you mapped locations or users to frequencies?
Using MapBox and a "point-in-polygon" algorithm, we found that each neighborhood had a unique density sound signature—the frequency of the sound we used increases when then density of Instagram posts increases. There's a bass tone every six hours to help give the listener a stronger sense of the passing day.
Future explorations of individual users
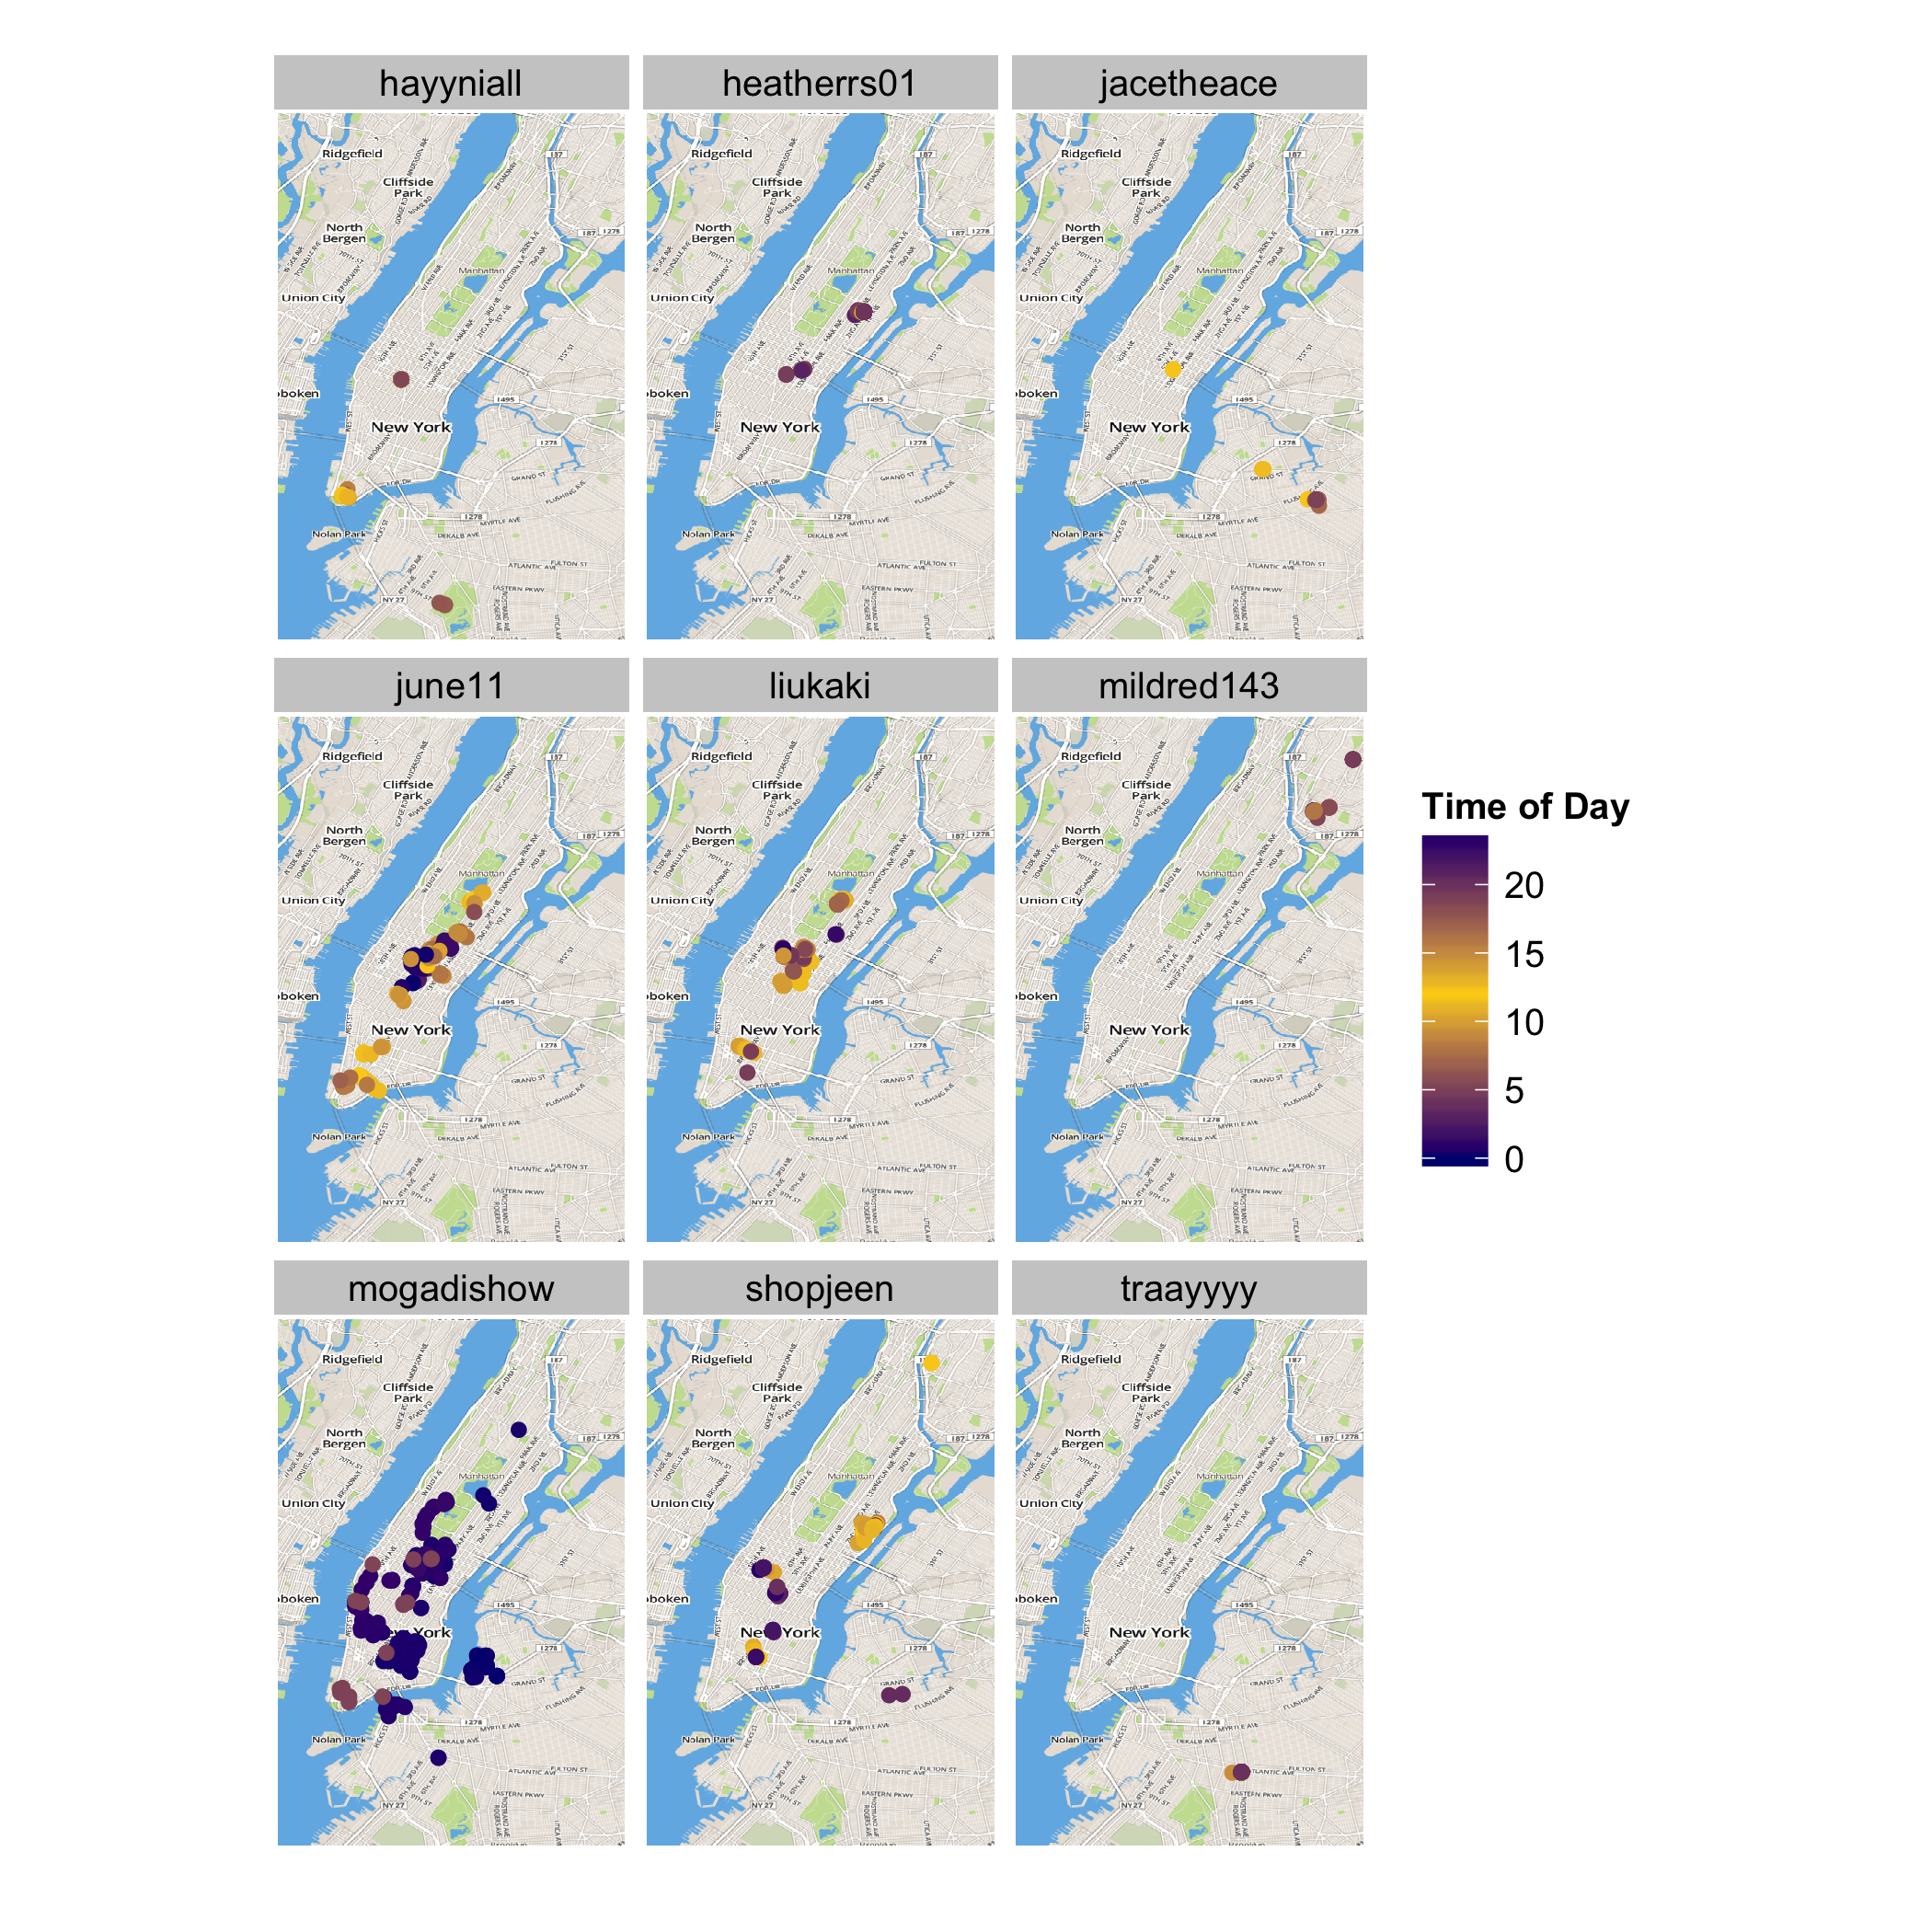
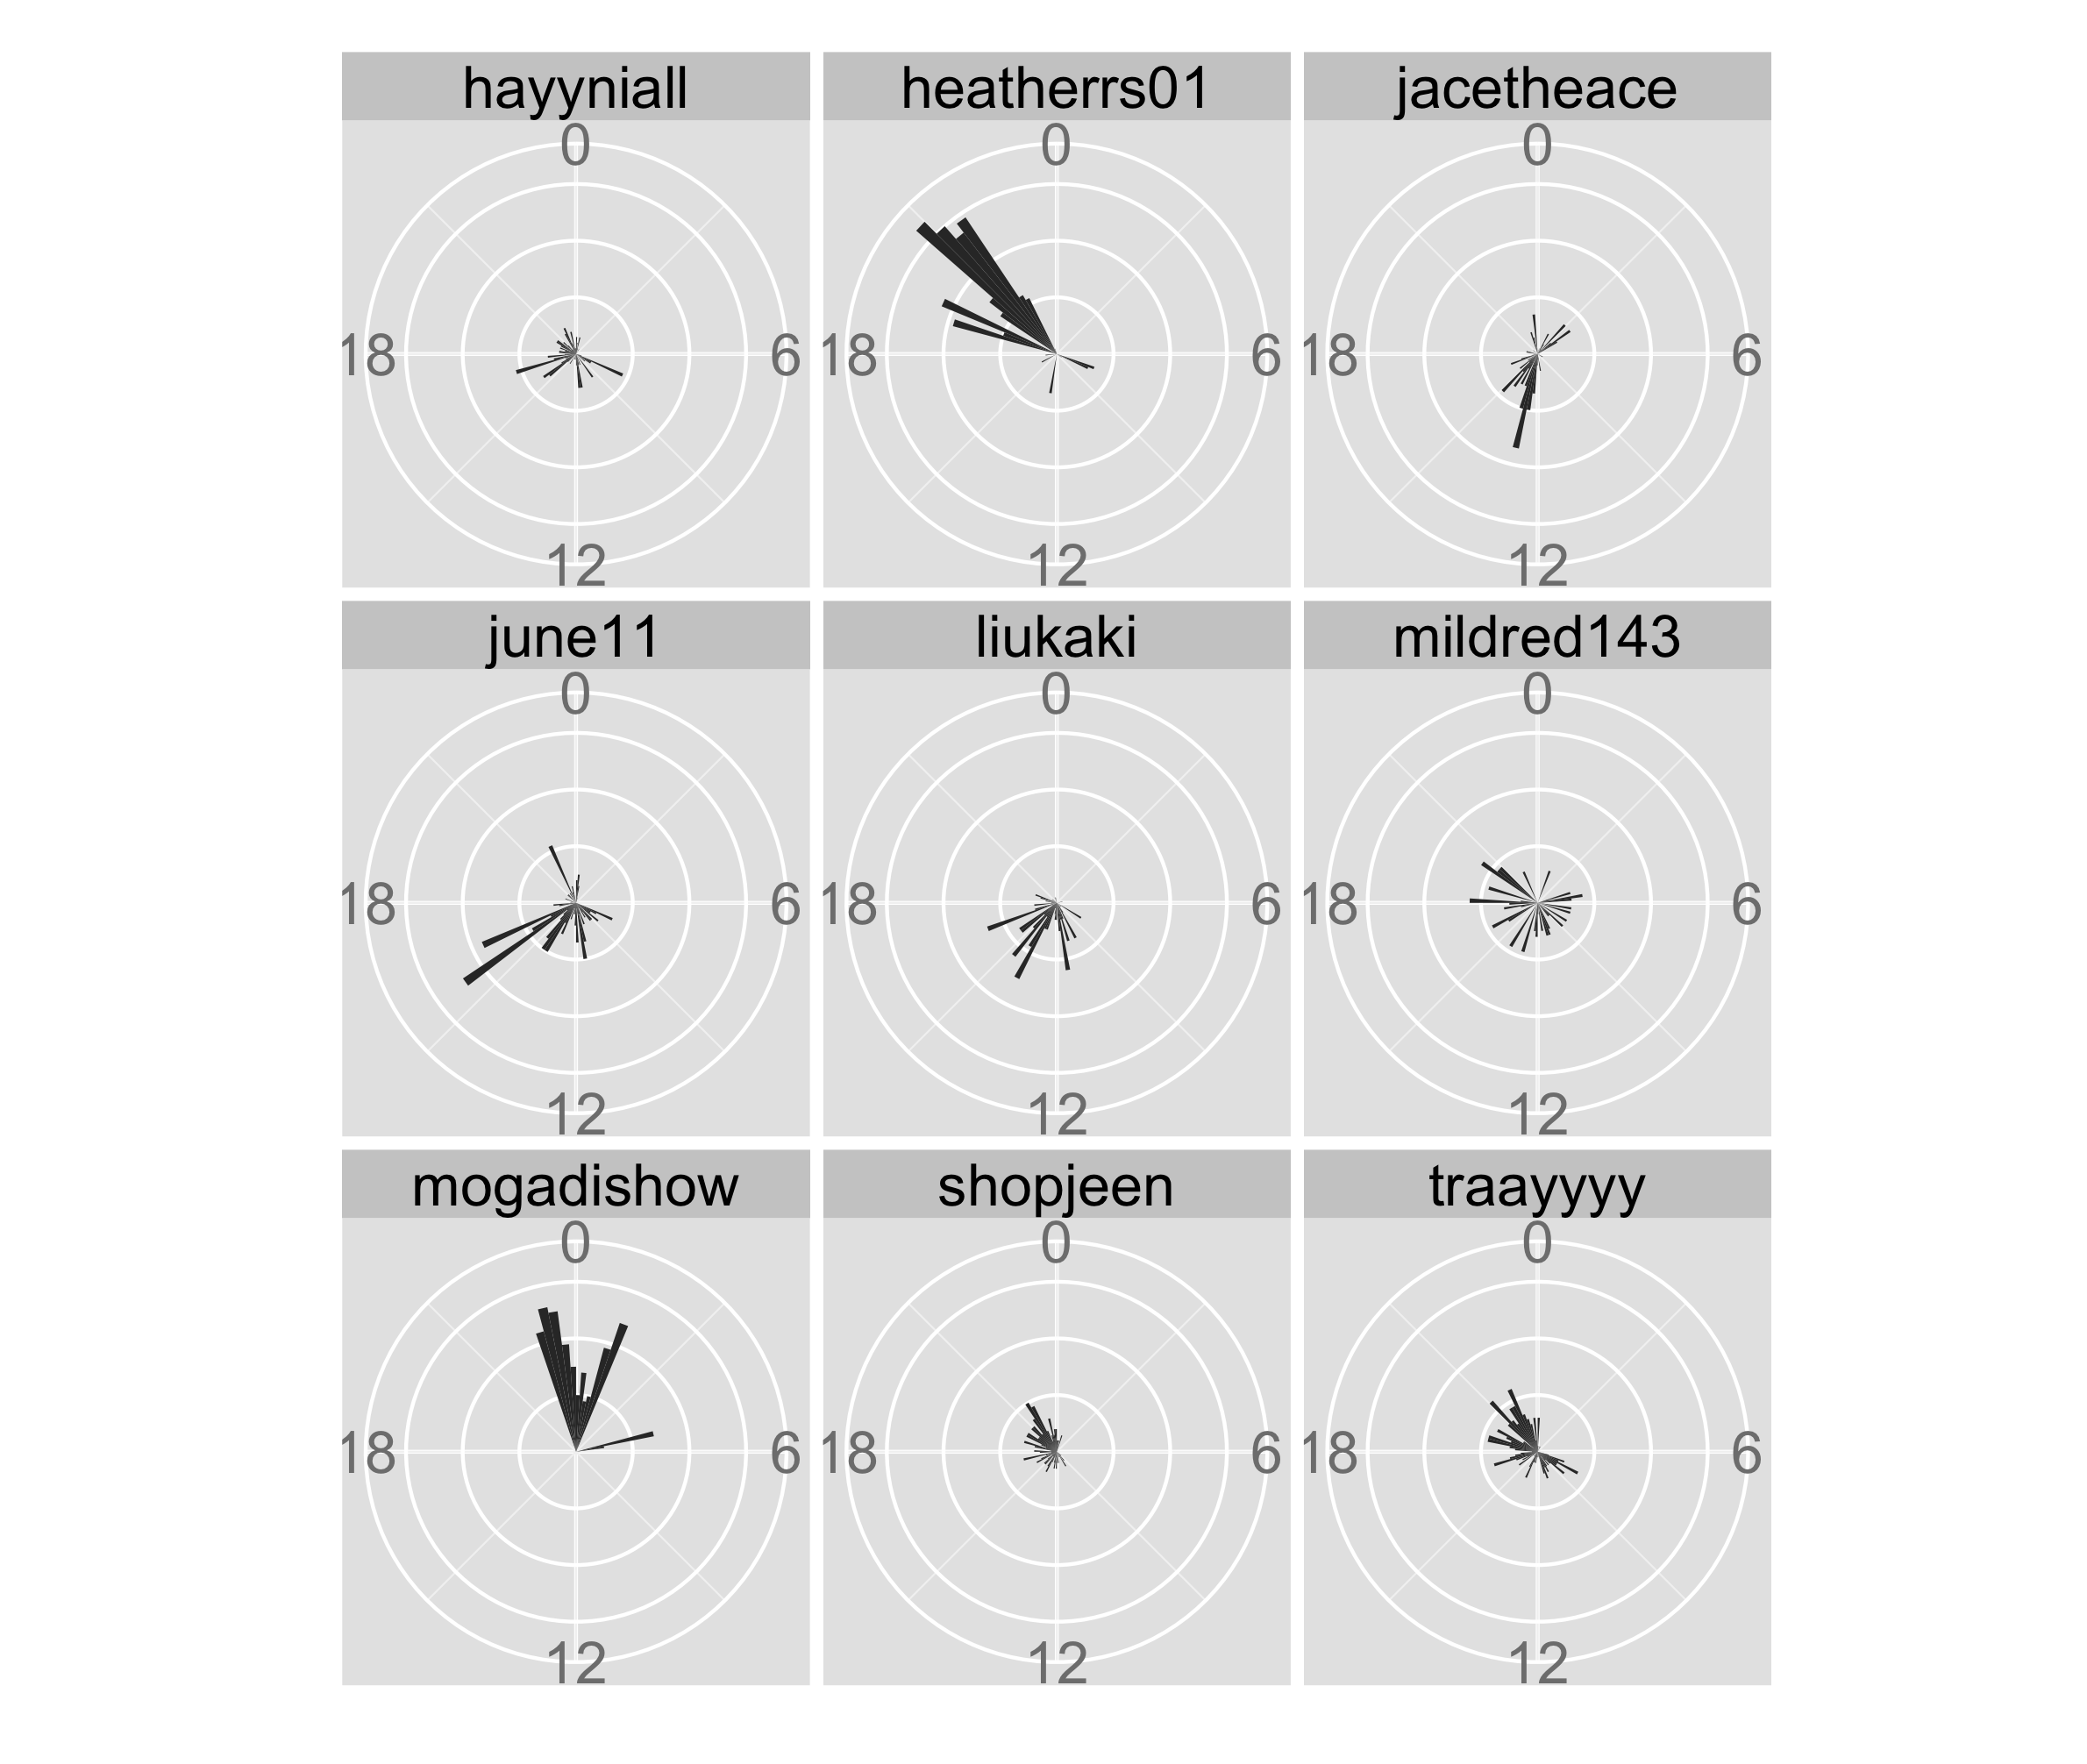
We are now starting to look at the distributions of posts for top users. Top users tend to post in 2-5 neighborhoods in a given week, which we can use to understand their movements, and perhaps make predictions about where they live and work. We can also use the patterns from individual users to better understand correlations between certain neighborhoods and heavy social media usage, or correlations between range of movement and highly engaged users. This preliminary visualization shows the movements of the ten most active Instagram users in the first week of October 2013.
Exploring the data
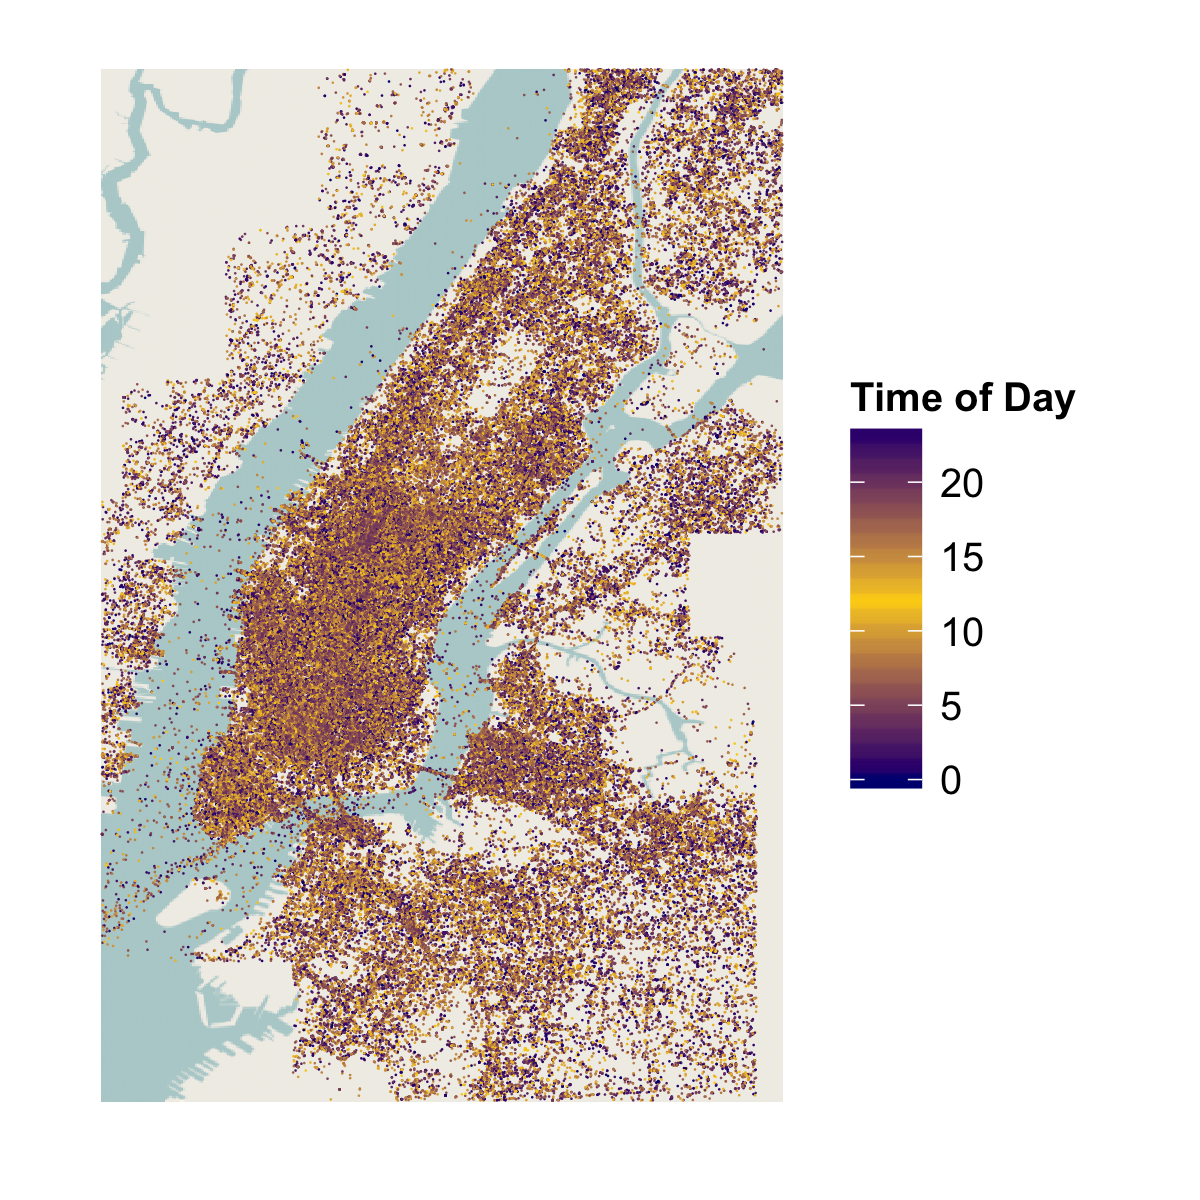
Our initial motivation was to use data to generate sonic compositions—ideally ones that represent patterns in large quantities of social data. Sonification, as a way to perceptualize information, can be a challenging way to convey meaning. Therefore, before we mapped any of our data to sound, we explored simple parameters and dimensions of our dataset—like geo-coordinates and timestamps—to understand meaningful differences in Instagram usage across New York City. We focused on understanding neighborhoods in New York, as well as the time of day that Instagram posts were made in each area.
In the chart below, you can see that there is a wide range in how many posts occur in different neighborhoods in the city:
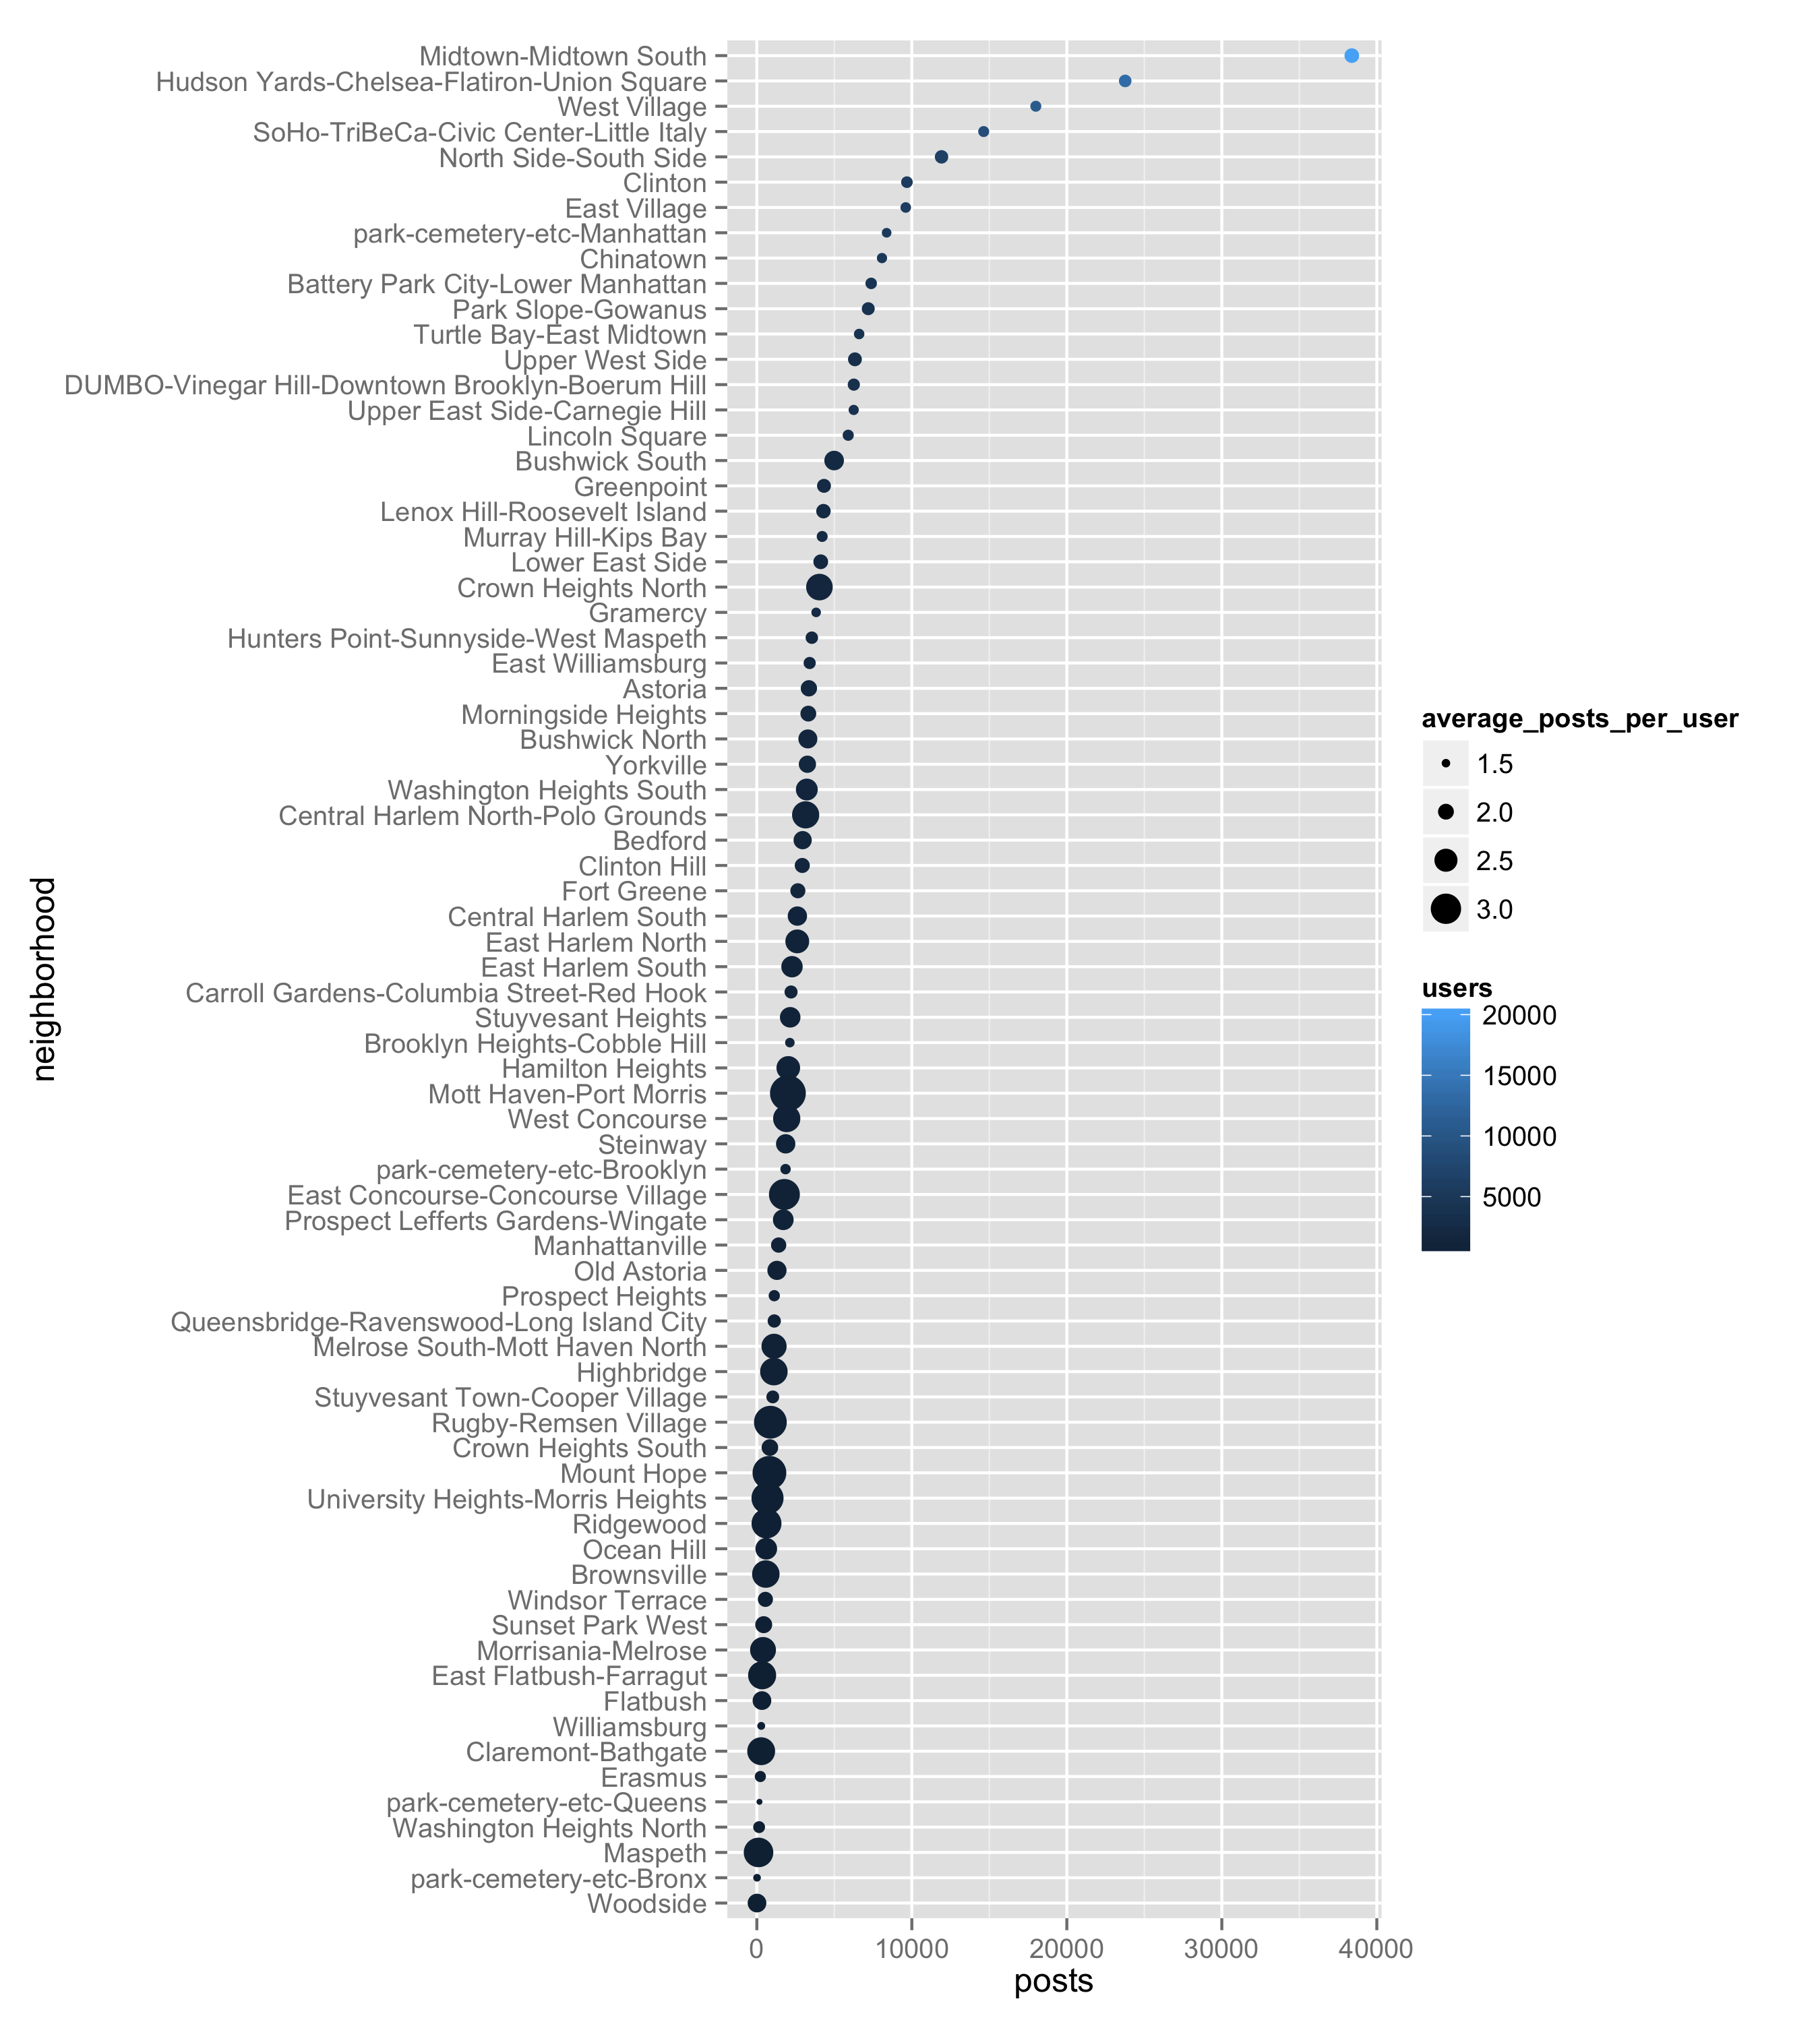
We started with basic questions: Where were they posted? What times of day? Who was posting?
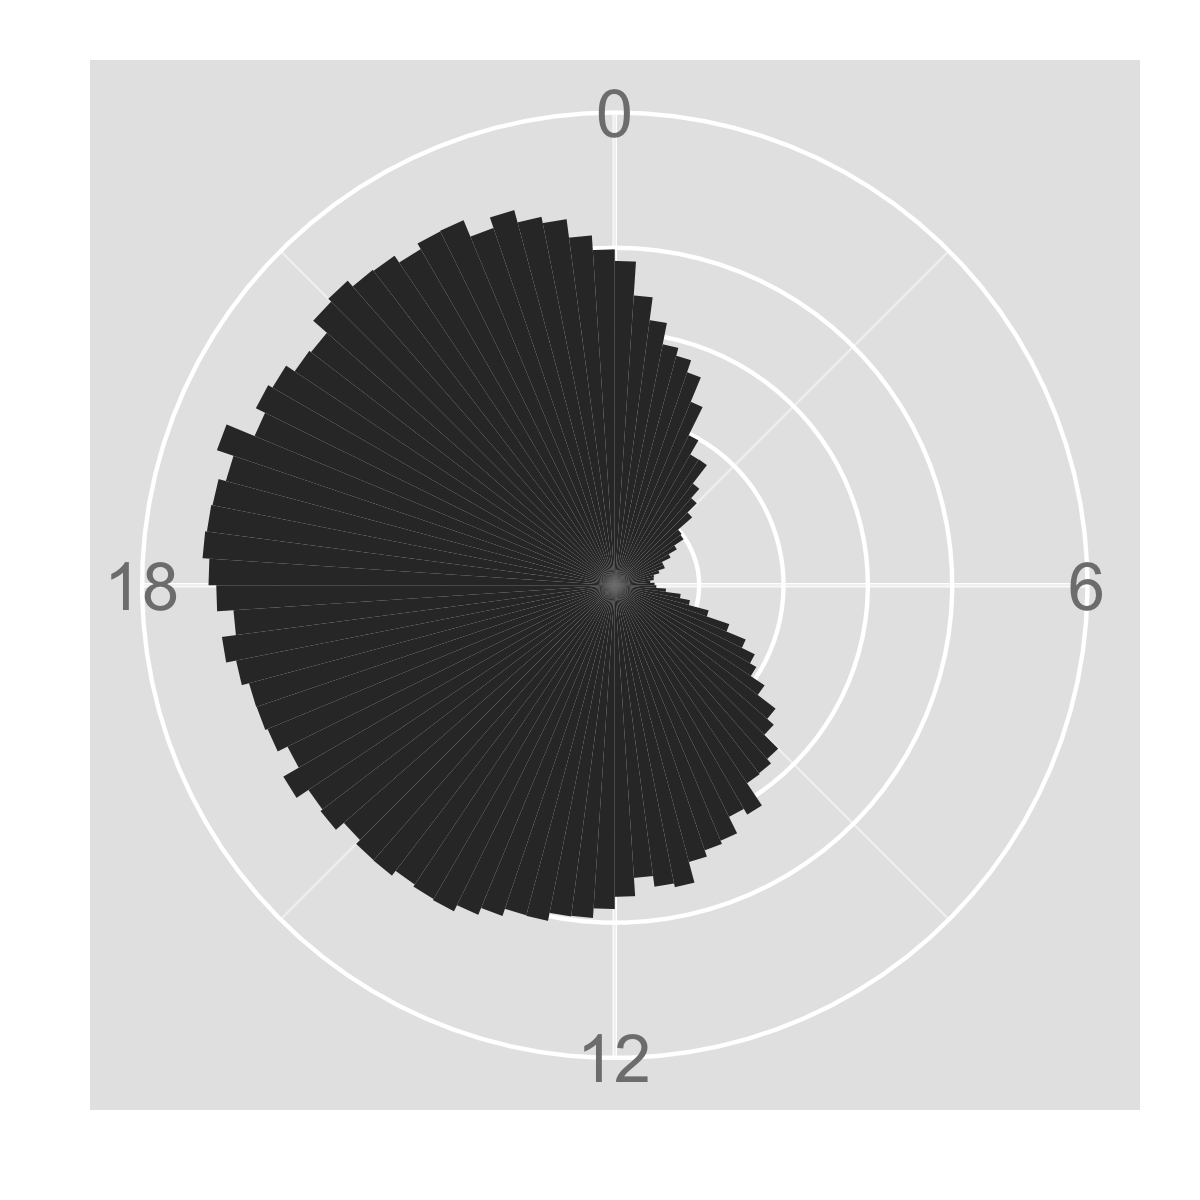
We used the geocoordinates of each post to visualize Instagram volume over an average day in the city.
A secondary way of seeing the density of posts over a single average day:
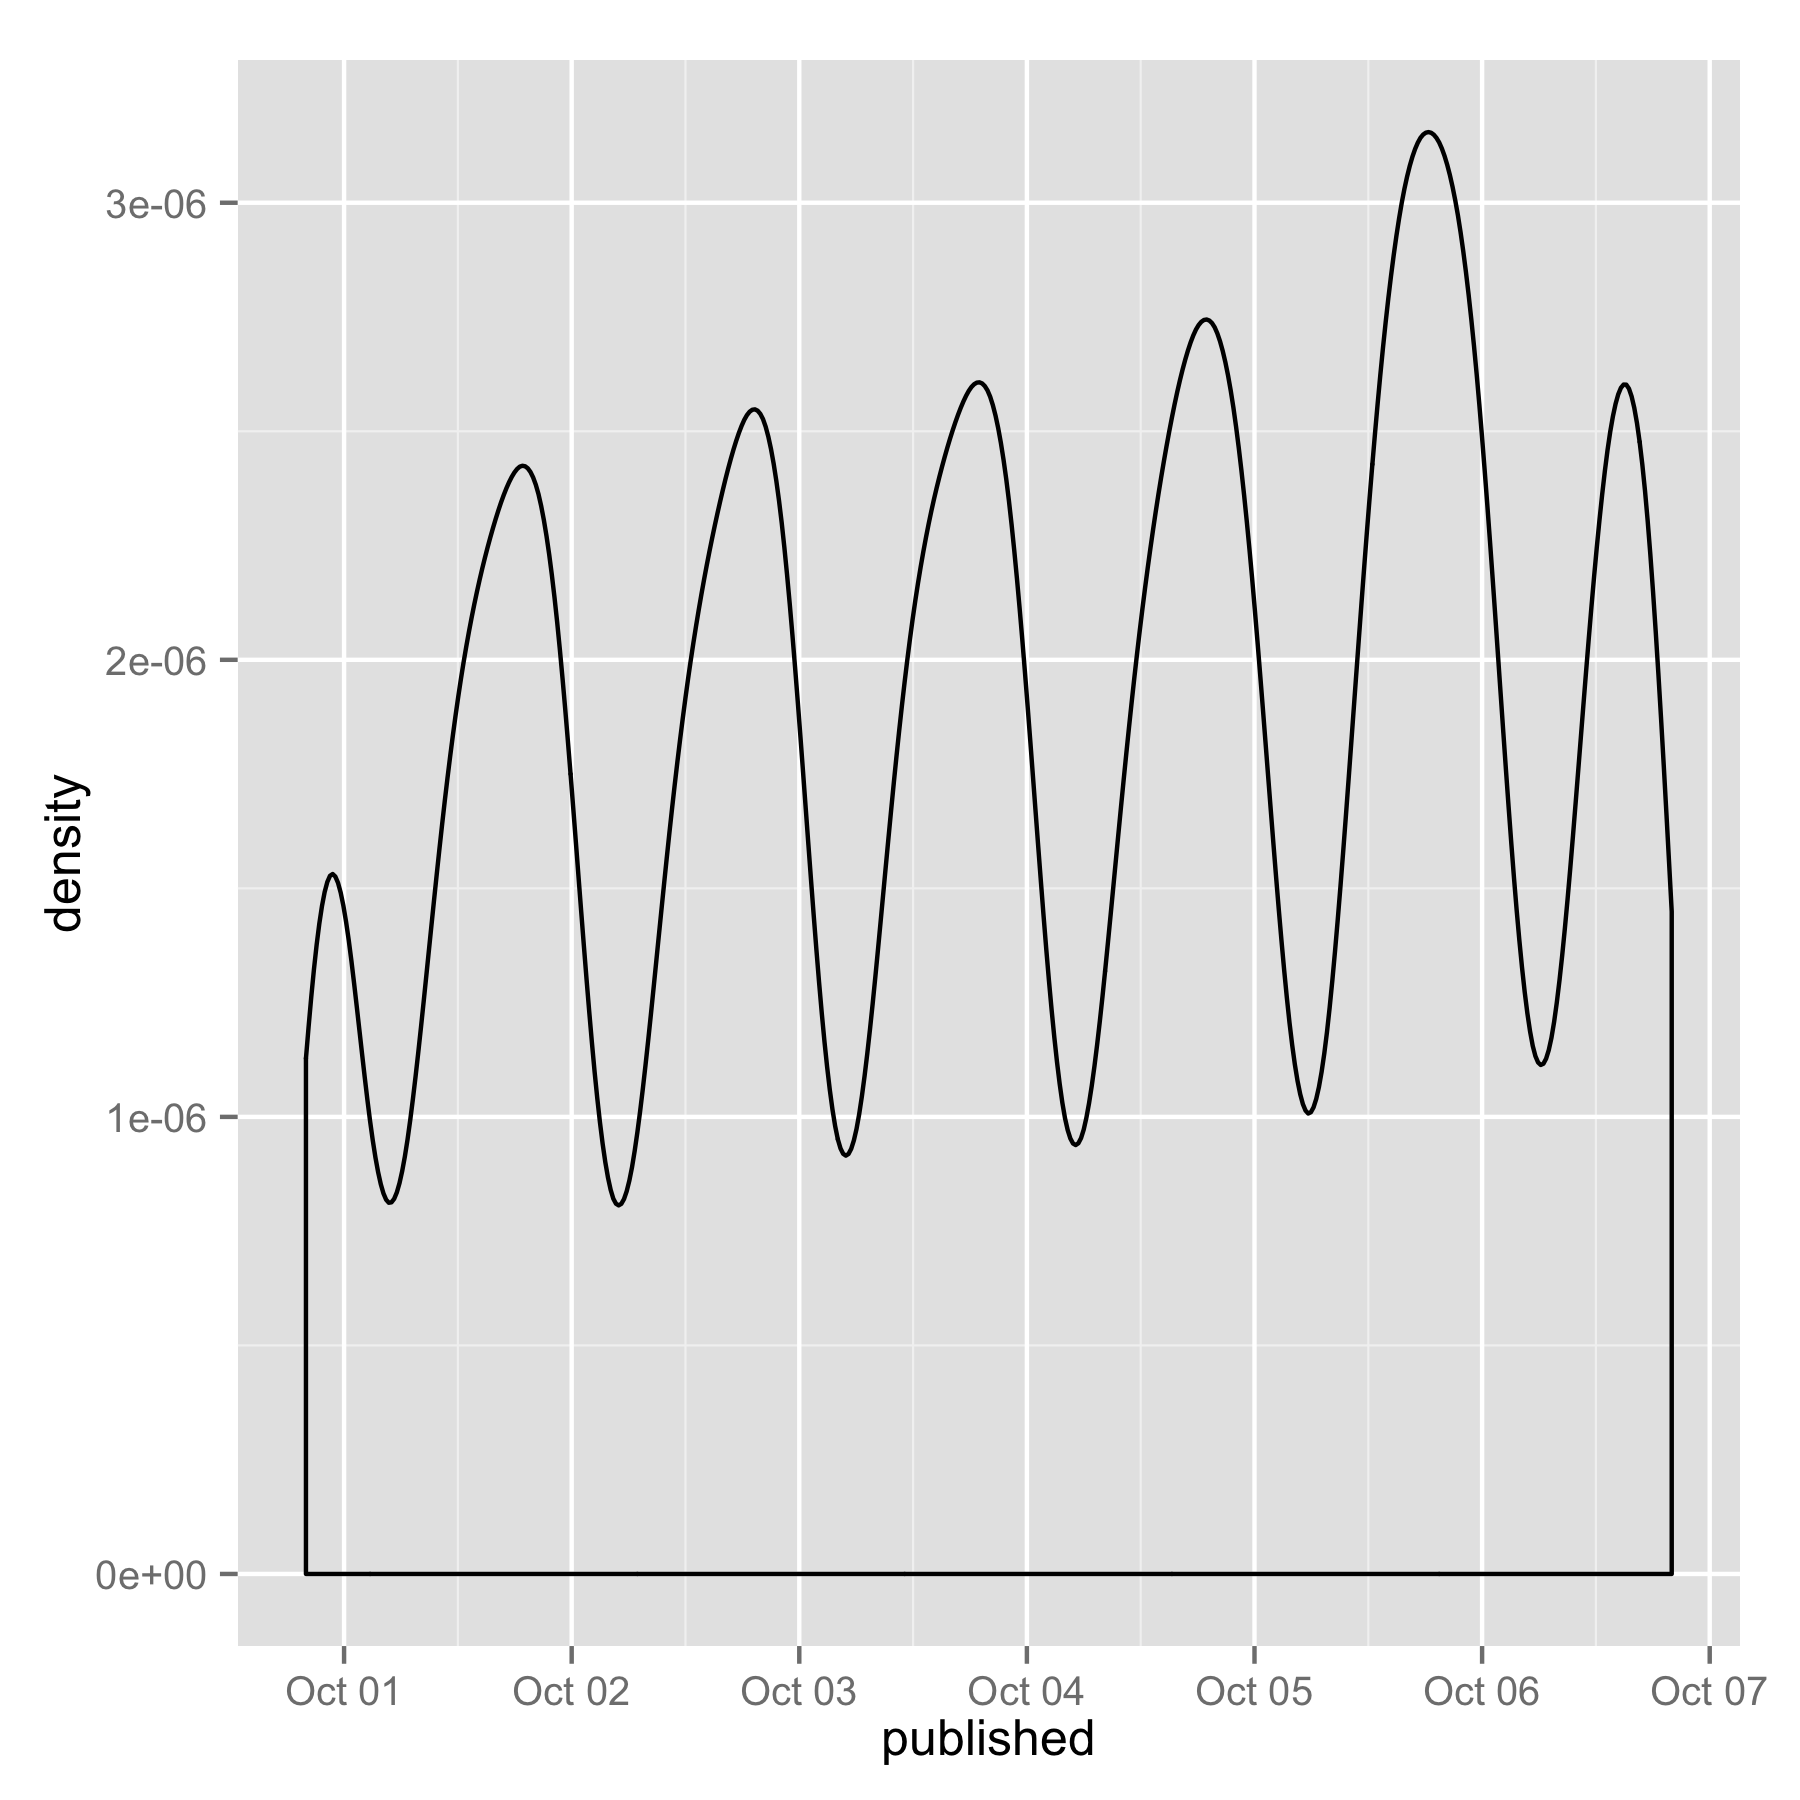 To better understand these density distributions, and to see if they varied widely from neighborhood to neighborhood, we looked at the volume of Instagram posts for specific areas, using MapBox and a "point-in-polygon" algorithm. We found that each neighborhood had a unique density signature, and chose to sonify this signature. By taking a week of Instagram data from October, we created histograms of posts over an average day. The frequency of the sound we used increases when then density of Instagram posts increases.